
Nifty finds support last Friday - What lies ahead?
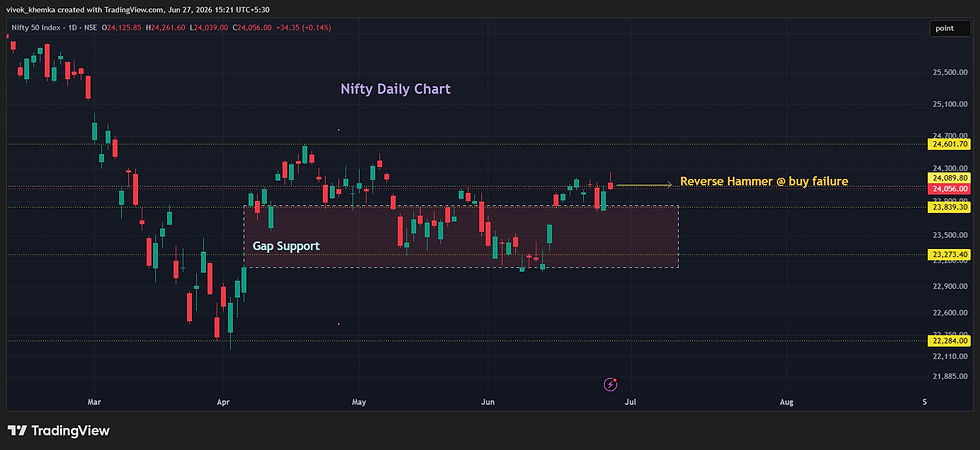
The chart below provides a fascinating example of how the price gets trapped between strong Gap Support below and Gap Resistance overhead and behaves like a ping pong ball.

1) A big Gap Up occured on 3rd Jul followed by a big decline on 8th Jul. The price retraced to produce another big Gap Up on 10th Jul that sits right below the former Gap.
2) Price gets sandwiched between the two gaps, Gap support below and Gap resistance above. For the next 7 days, the price seesaws between the two zones until it finally breaks down on 23rd July.
3) Last Friday 24th July, the price declined to the lower boundary on another massive Gap support zone that formed on 15th June and rebounded sharply.
4) While the price closed in the middle of the range ~23767 (Nifty spot), the price action of a strong rebound from support looks very reassuring and good to carry price to the top boundary ~24K.
You will never know these levels if you do not mark these Gaps on your charting landscape - these zones provide valuable insights on price action that are otherwise not visible. This is what provides the edge to your trading that the majority does not know about.
Please scroll below to subscribe for regular updates on the global financial and commodity markets.

Comments