

Chapter 3 - Setups for Nifty Futures
3.1 Chart Setups: An Introduction to Deciphering Price Action on Nifty
Before we dive into specific chart setups, it is important to understand the basic structure and terminology used in our Trading System. This will ensure complete clarity as you move forward through the material.
Understanding Candles in This System
Whenever candles are referred to in this system:
-
Intraday trading uses 1-hour (1H) candles
-
Positional / swing trading uses daily (D) candles
This distinction is important, as the same concepts apply across both styles, but on different timeframes.
Intraday Trading Structure for Nifty Futures
Nifty Futures on NSE trades from 9:15 AM to 3:40 PM. For simplicity and consistency, the trading day is divided into specific time blocks, referred to as C1 to C7.
Candle Structure
-
C1: 9:15 AM – 10:00 AM (45 minutes)
-
C2: 10:00 AM – 11:00 AM (1 hour)
-
C3: 11:00 AM – 12:00 PM (1 hour)
-
C4: 12:00 PM – 1:00 PM (1 hour)
-
C5: 1:00 PM – 2:00 PM (1 hour)
-
C6: 2:00 PM – 3:00 PM (1 hour)
-
C7: 3:00 PM – 3:40 PM (40 minutes)
Key Trading Windows
While the entire day is observed, trades are typically taken only at specific points where the probability of meaningful movement is higher.
Primary Trading Windows
-
10:00 AM (after C1 closes)
-
1:00 PM (after C4 closes)
-
2:00 PM (after C5 closes)
These are the main decision points in the trading day.
Additional Notes
-
Trades at C2 (11:00 AM) are rare and only taken under specific conditions.
-
If a trade is taken at C1 or C2, no further trades are initiated for the rest of the day.
-
All trades are intraday only and are exited by 3:25 PM. No positions are carried forward.
This is designed to avoid the final 15 minutes to steer clear of volatility induced by liquidity/position adjustments and closing-related activity.
Why These Trading Windows Matter
C1 (10:00 AM) – Capturing Early Momentum
The first trading window focuses on capturing strong moves from the market open. These moves can occur:
-
In the direction of the prevailing trend, or
-
As sharp reversals driven by overnight sentiment
Early moves often carry momentum and can offer quick opportunities.
C4 (1:00 PM) and C5 (2:00 PM) – Higher Probability Setups
The later trading windows are generally more reliable.
By this time:
-
The market has already formed 4–5 hourly candles
-
Early noise and indecision are reduced
-
Clearer price action patterns and setups begin to emerge
This allows traders to make more informed and structured decisions, rather than reacting to early market volatility.
Chart Pattern vs Chart Setup
At this point, it’s important to remember the distinction between the two :
-
Chart Setup: A single or multiple candles forming a tradable structure that meets stringent conditions as defined by our system.
-
Chart Pattern: Classical technical structures such as Head & Shoulders, Double Top/Bottom, 1-2-3 formations, Triangles, Flags, Pennants, and Rectangles.
A Chart Pattern may or may not be a tradable setup as defined by our system.
A setup gives you a signal. A pattern gives it context. When both align, the trade gains conviction with higher probability of success. For example, a strong Bullish Engulfing pattern that forms at a double bottom and breaks out is more convincing than one that is not part of any chart pattern.
Where the Edge Lies
High-quality setups typically occur:
-
Before a breakout/breakdown (final leg of the pattern). Example : Bullish Engulfing at a Double Bottom that is yet to break out
-
During the breakout/breakdown. Example : Big Green breakout from a Reverse H&S or range
-
After the breakout/breakdown, on the next candle or a combination of 2-3 candles. Example : Bullish Harami after a breakdown from a prominent support, aka sell failure
-
At S/R. Example : A Hammer at the lower boundary of a wide range or at strong horizontal support
Apart from the above, there are advanced setups such as Outside Strong Green or Red that occur as part of a trending move without a breakout/ breakdown or without S/R. Such setups are part of the proprietary setups not covered as part of this content.
A Pure Price Action Approach
Our Trading System is built entirely on price action, without the use of technical indicators. While indicators are popular, they often lag behind price and can create conflicting or misleading signals, leading to noise and confusion.
By focusing only on candles, patterns, support/resistance and market structure, this approach aims to:
-
Eliminate unnecessary complexity
-
Reduce noise
-
Provide a clearer and more direct understanding of market behavior
3.2 Trading Setups – Intraday vs Positional
The following section outlines a set of bullish and bearish trading setups applicable to both intraday and positional trading. These setups are broadly classified into two categories—Mainstream and Proprietary.
The Mainstream setups are well-established patterns widely documented in technical analysis literature and commonly used by traders.
In contrast, the Proprietary setups are derived from the author’s experience and are the result of extensive observation of price behavior, particularly in situations where conventional setups fail.
These proprietary approaches primarily focus on what is often referred to as the “trap effect”—scenarios where market participants are positioned incorrectly, leading to sharp and decisive moves in the opposite direction. When identified correctly, such setups can offer high-probability trading opportunities.
While the Mainstream setups are explained in detail in the sections that follow, the Proprietary setups are advanced and are intended for more experienced traders. Traders interested in gaining access to these advanced concepts may reach out to the author for further information.
Mainstream Setups

Proprietary Setups

3.3 Mainstream Trading Setups - Bullish
There are six Bullish Mainstream Trading setups. The setup conditions, both for Intraday and Positional trading, are given below.
Setup Conditions Intraday:
Setups 1-4 : Any of these setups should form on C3, C4 or C5. If the setup forms at C3, C4 should only be a narrow-range candle (red or green) or a small doji indicating consolidation. Trades should be taken only at C4 or C5.
Setup 5: Piercing Pattern - Not applicable for Intraday Trading.
Setup 6 : Big Green on C1 (or C2) only forms on C1 or C2, in the morning, as the name suggests.
Setup Conditions Positional:
Setups 1-5 : Any of these setups could form any day by the time the daily candle is about to close before 3:40 PM.
Setup 6: Big Green on C1/C2 not applicable for Positional Trading.
3.3A Mainstream Trading Setups - Bullish
Bullish Setup 1 - Bullish Engulfing
Bullish Engulfing is a two-candlestick reversal pattern that forms after a noticeable decline.

To be considered tradable within our strategy, the setup must meet specific criteria.
Key Elements for Trade Selection : A good trade should preferably meet most of the elements, based on the overall context of the charting landscape - if you are not sure, do not chase the trade.
-
The bigger the size of the real body engulfing the real body of the prior candle, the stronger the setup.
-
The more number of prior candles engulfed, the stronger the setup.
-
Setup forming at prior support level adds to conviction. A confluence of supports is ideal. For example, a setup at the intersection of strong horizontal and gap support has higher odds of success than one at a simple double bottom (2B).
-
A setup that forms as a part of a small consolidation (a range or a bullish chart pattern) after a substantial decline adds conviction. It signals that the consolidation may be over and the price ready to move northward. Avoid trades if the setup forms without any support or weak support without any consolidation.
-
A Bullish Engulfing forming within a narrow range or narrow consolidation without any preceding decline does not qualify as a setup. Avoid.
CHART EXAMPLES
Intraday

Fig 2.1 - 1H chart of Nifty Index - Bullish Engulfing on C5 at Horizontal Support

Fig 2.2 - 1H chart of Nifty Futures - Bullish Engulfing on C5 as part of a small 1-2-3 bottom

Fig 2.3 - 1H chart of Nifty Futures - Bullish Engulfing on C5 as part of a small double bottom

Fig 2.4 - 1H chart of Nifty Futures - Bullish Engulfing on C4 with a large real body engulfing 6 prior candles
Positional

Fig 2.5 - Daily chart of Nifty Futures - Bullish Engulfing at double bottom that also breaks out of the pattern

Fig 2.6 - Daily chart of Nifty Futures - Bullish Engulfing at double bottom within a wide range

Fig 2.7 - Daily chart of Nifty Futures - A variation of Bullish Engulfing at double bottom with one intervening candle in between. Note the massive gap up and down that precedes and follows the intervening candle, making the pattern chaotic and difficult to conceive
Bullish Setup 2 - Hammer at Support
This setup is a single candlestick reversal pattern that forms after a noticeable decline. It has a small body near the high of the candlestick with a long lower shadow, resembling a hammer.

To be considered tradable within our strategy, the setup must meet specific criteria:
Key Elements for Trade Selection : A good trade should preferably meet most of the elements, based on the overall context of the charting landscape - if you are not sure, do not chase the trade.
-
The lower wick of the candle should be at least twice the size of the real body of the hammer. The longer the lower wick, the stronger the setup.
-
Setup forming at prior support level adds to conviction. A confluence of supports is ideal. For example, a setup at the intersection of strong horizontal and gap support has higher odds of success than one at a simple double bottom (2B). Avoid trades if the setup forms without any support or at weak support.
-
A Hammer forming within a narrow range or narrow consolidation without any preceding decline does not qualify as a setup. Avoid.
CHART EXAMPLES
Intraday

Fig 2.8 - 1H chart of Nifty Futures - Small Hammer at strong support after a significant decline

Fig 2.9 - 1H chart of Nifty Futures - Narrow range doji at strong support after a significant decline. Even though the shape is not a copybook hammer, the psychology behind the setup holds good. Hence the setup is valid.

Fig 2.10 - 1H chart of Nifty Futures - Hammer at double bottom after a significant decline. However, the price does not go up the same day, but opens gap up the next day.
Positional

Fig 2.11 - Daily chart of Nifty Futures - Multiple instances of hammer forming at the lower boundary of a wide range. Notice how the price bounces between the upper and lower boundaries forming a hammer on 4 occasions at or near the lower boundary.

Fig 2.12 - Daily chart of Nifty Futures - 2 instances of Hammer forming after a significant decline. In the first instance, the hammer forms without support but works. In the second instance, the hammer forms at a double bottom but fails to work.
Bullish Setup 3 - Range / Pattern breakout
This setup is characterized by a single candlestick with a relatively large green body that overcomes strong overhead resistance and breaks out of a range or pattern. The breakout indicates strong bullish momentum and the potential for further price expansion.

To be considered tradable within our strategy, the setup must meet specific criteria:
Key Elements for Trade Selection : A good trade should preferably meet most of the elements, based on the overall context of the charting landscape - if you are not sure, do not chase the trade.
-
The close should preferably be above the nearby resistance. However, it is acceptable if the close is just below the highest high of the nearby candles but above the real bodies, provided the breakout candle is strong (relatively taller than average) and closes near its high. If you are not sure, avoid.
When the price gaps down, a close above the opening gap down, such that the gap gets closed, is a valid signal to go long as the strong resistance offered by the gap is overcome.
-
Avoid trades if the big green candle is the first breakout close above a prominent range or pattern formed over several days like a big Reverse H&S or a prominent range. Such a conspicuous breakout attracts the attention of the crowd who jump in at the first opportunity. Subsequently, price often retraces, trapping buyers.
It's safer to wait for a retracement to resistance (or below) and enter on a second breakout.
Proceed with the trade if the breakout is not very prominent.
-
Avoid if the breakout candle closes at or below resistance as the overhead resistance may prevent further expansion. For a close within a wide range, go ahead with the trade if there is sufficient room to expand.
CHART EXAMPLES
Intraday

Fig 2.13 - 1H chart of Nifty Index - 1-2-3 Bottom breakout on C4 within a larger double bottom pattern.

Fig 2.14 - 1H chart of Nifty Index1-2-3 Bottom breakout on C5 with close below the pivot high

Fig 2.15 - 1H chart of Nifty Futures - Narrow range breakout on C4

Fig 2.16 - 1H chart of Nifty Futures - 2nd breakout from range after first failure - strong green candle that closes near its high

Fig 2.17 - 1H chart of Nifty Futures - Big Green candle breakout that closes within a narrow congestion zone. No setup.

Fig 2.18 - 1H chart of Nifty - Strong close on C4 above overnight gap down. A variation of the setup.
Positional

Fig 2.19 - Daily chart of Nifty Futures - A perfect 1-2-3 bottom breakout on 18-Mar-25. Also a smaller range breakout that forms within the larger pattern.
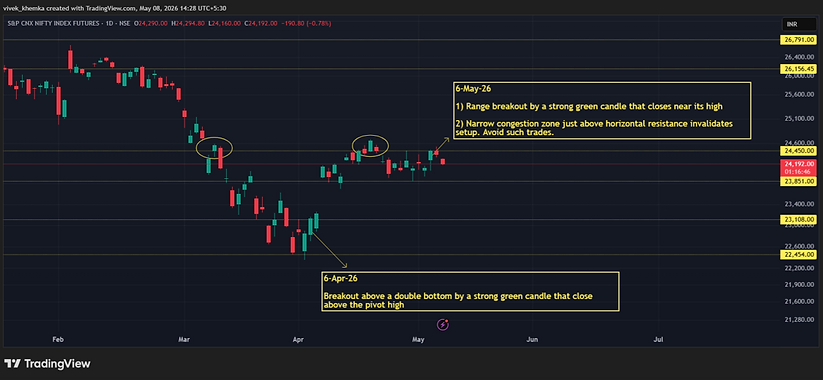
Fig 2.20 - Daily chart of Nifty Futures - Double bottom breakout on 6-Apr-26 after a strong downtrend. Range breakout on 6-May-26 that closes in a narrow congestion zone, to be avoided.

Fig 2.21 - Daily chart of Nifty Futures - Conspicuous range breakout on 26-Jun-25. To be avoided as such breakouts lead to crowded trades because of retail interest and participation.

Fig 2.22 - Daily chart of Nifty Futures - Multiple examples of pattern and range breakouts in a bullish trend

Fig 2.23 - Daily chart of Nifty Futures - A perfect breakout from a reverse H&S pattern that fails on the following candle leading to a fast and furious trend in the opposite direction.
Bullish Setup 4 - Bullish Harami
This signal is a combination of two candlesticks, of which the first is a big red candle and the second is a narrow range (NR) green candle, a.k.a Harami candle, that closes within the real body of the prior big red candle, closing higher. While the first candle signifies strong bearish momentum, the second candle fails to follow through, suggesting a possible exhaustion of bearish momentum and hence, a reversal.

To be considered tradable within our strategy, the setup must meet specific criteria:
Key Elements for Trade Selection : A good trade should preferably meet most of the elements, based on the overall context of the charting landscape - if you are not sure, do not chase the trade.
-
The red candle’s real body should be longer than average and close should be near its low, signifying strong bearish momentum.
-
The signal candle should have a narrow range and should preferably close near its high, within the lower half of the real body of the prior long red candle.
-
The signal candle’s low should not breach the low of the red candle, preferably, or the breach should be small. If the former travels significantly lower before pulling back, it is no longer a Bullish Harami but probably a Hammer. It is important to distinguish between the two as both have different payoffs.
-
The big red and the harami candle either form at prior support or after a breakdown by the prior big red candle from a range or pattern. The latter is a particularly stronger setup because of the potential "trap effect". Avoid signals that form in a range or vacuum without any nearby support.
CHART EXAMPLES
Intraday

Fig 2.24 - 1H chart of Nifty Index - Bullish Harami on C4 at horizontal support after a big green breakout the prior day

Fig 2.25 - 1H chart of Nifty Index - Bullish Harami on C5 in a narrow congestion zone that provides support

Fig 2.26 - 1H chart of Nifty Index - Bullish Harami on C4 at horizontal support close to a double bottom from prior day

Fig 2.27 - 1H chart of Nifty Index - Bullish Harami on C4 at double bottom support from prior day
Positional

Fig 2.28 - Daily chart of Nifty Index - Multiple examples of Bullish Harami at support

Fig 2.29 - Daily chart of Nifty Index - Bullish Harami at horizontal and gap support, part of a larger 1-2-3 bottom

Fig 2.30 - Daily chart of Nifty Index - Bullish Harami at horizontal support. However, the signal fails to work.
Bullish Setup 5 - Piercing Pattern
Piercing Pattern is comprised of a single candlestick, that often appears after a significant bearish trend. It opens below the previous candle’s low but closes within the real body of the previous candle, preferably above its midpoint. However, for the purpose of this setup, a candle opening with a large gap down but reversing to close strong even within the gap is considered as a valid setup. The setup often signals a strong reversal of the ongoing bearish trend to bullish.
The setup is valid only for positional trading as a gap down rarely occurs in the course of intraday trading.

To be considered tradable within our strategy, the setup must meet specific criteria:
Key Elements for Trade Selection : A good trade should preferably meet most of the elements, based on the overall context of the charting landscape - if you are not sure, do not chase the trade.
-
The present trend should be preferably down or sideways. Typically, the signal often marks a false breakdown from a range or a pattern on the downside followed by a trap reversal.
-
A strong setup can form in either of the two ways described below, with the latter being stronger, as it is a sell failure.
I. Open with a significant gap down (avoid small gap downs), with the low testing prior support without breaching it . Strong reversal thereafter to fill the opening gap and close near its high, in the real body of the previous red candle.
II. Open with a significant gap down below support and subsequent reversal to close above support. This adds conviction to the setup as it traps the bears, strongly implying a move in the opposite direction.
Sometimes, when the opening gap is abnormally large and below strong support (usually because of an adverse development overnight), the piercing pattern may not be able to fill the gap completely, but still close strong inside the gap, near its high. This is also an acceptable bear trap signal that has strong implications of an aggressive upward move.
-
There is enough room to expand to meet the price target. Avoid when the close is in the middle of strong congestion or below significant overhead resistance.
CHART EXAMPLES
Positional

Fig 2.31 - 1D chart of Nifty Index - Piercing Pattern setup in 2 instances on the daily chart in a prevailing uptrend. In the first instance, the open/ low is below support and in the second, it is close to horizontal support. The price reverses powerfully in both instances.

Fig 2.32 - 1D chart of Nifty Index - Piercing Pattern setup in a downtrend where the price opens below support, dips further below but reverses sharply to close near the prior close. The setup reverses the downtrend temporarily before it resumes.

Fig 2.33 - 1D chart of Nifty Futures - Piercing Pattern setup in the first instance reverses a downtrend. The setup fails in the second instance as it closes in the middle of significant overhead resistance. Such setups should be avoided.

Fig 2.34 - 1D chart of Nifty Futures - Multiple instances of the setup. In the 2nd and 3rd instances , price opens at strong support but faces strong overhead resistance and fails. Such setups should be avoided.
Bullish Setup 6 - Big Green on C1 or C2
This setup is a single strong green candle that forms on either C1 or C2, which is a continuation of an existing bullish trend or a bullish breakout from a range or pattern. Most of the signals appear on C1, however, if C1 does not offer clarity or is a weak candle but C2 clearly establishes a breakout, the setup remains valid.
Unlike the previous setups, it is an intraday only setup that is traded in the morning, mainly to ride any big trend that sets up in the morning rather that wait till the afternoon by which time the major part of the move would be over.

To be considered tradable within our strategy, the setup must meet specific criteria:
Key Elements for Trade Selection : A good trade should preferably meet most of the elements, based on the overall context of the charting landscape - if you are not sure, do not chase the trade.
-
The big green candle on either of C1 or C2 must form under one of two scenarios:
Bullish Continuation: The trend on the daily timeframe should be already bullish, and C1 (or C2) reaffirms the continuation of this trend.
Bullish Breakout: There should be a clear range or a bullish pattern forming on the hourly chart (from previous day/s), and C1 (or C2) represents a clear breakout. The trend on the daily chart should be preferably bullish but can also be bearish before consolidating sideways to form a range or pattern.
-
Avoid the trade if the big green candle closes just below overhead resistance or within a narrow congestion zone which offers no room to expand.
-
In the case of a breakout, avoid the trade if the signal breakout candle opens with a massive gap such that the technical target is already met. In such instances, price is likely to go sideways or even retrace.
-
The close of the signal candle should be near its high. In case of a long upper wick, avoid the trade.
CHART EXAMPLES
Intraday

Fig 2.35 - 1H chart of Nifty Index - Multiple instances of Big Green on C1/C2. The first setup is not valid because if overhead resistance. The second and third setups are good setups.

Fig 2.36 - 1H chart of Nifty Index - In the first instance, C1 signifies the failure of a H&S pattern breakdown the previous day, a very powerful signal. The second instance shows the setup forming on C2 that breaks above a 1-2-3 bottom.

Fig 2.37 - 1H chart of Nifty Index - Multiple instances of Big Green on C1/C2 in an ongoing uptrend

Fig 2.38 - 1H chart of Nifty Index- Multiple instances of Big Green on C1/C2 in an ongoing uptrend. The first setup is not valid as it opens at prior resistance after a massive gap up.
3.3B Mainstream Trading Setups - Bearish
Bearish Setup 1 - Bearish Engulfing
Bearish Engulfing is a two-candlestick reversal pattern that forms after a noticeable rise.

To be considered tradable within our strategy, the setup must meet specific criteria:
Key Elements for Trade Selection : A good trade should preferably meet most of the elements, based on the overall context of the charting landscape - if you are not sure, do not chase the trade.
-
The bigger the size of the real body engulfing the real body of the prior candle, the stronger the setup.
-
The more number of prior candles engulfed, the stronger the setup.
-
Setup forming at prior resistance level adds to conviction. A confluence of resistances is ideal. For example, a setup at the intersection of strong horizontal and gap resistance has higher odds of success than one at a simple double top (2T).
-
A setup that forms as a part of a small consolidation (a range or a bearish chart pattern) after a substantial rise adds conviction. It signals that the consolidation may be over and the price ready to move southward. Avoid trades if the setup forms without overhead resistance or at weak resistance without any consolidation.
-
A Bearish Engulfing forming within a narrow range or narrow consolidation without any preceding rise does not qualify as a setup. Avoid.
CHART EXAMPLES
Intraday

Fig 2.39 - 1H chart of Nifty Index - Bearish Engulfing forms on C5 in the middle of a wide range at prior gap resistance.

Fig 2.40 - 1H chart of Nifty Futures - Bearish Engulfing forms on C4 in the middle of a modestly wide range

Fig 2.41 - 1H chart of Nifty Futures - Bearish Engulfing forms on C4 at a double top at the upper boundary of a small range.

Fig 2.42- 1H chart of Nifty Futures - Massive Bearish Engulfing forms on C5 at a big overnight gap down from 2 days back. Also marks the failure of a breakout from a Reverse H&S hence a high conviction trade.
Positional

Fig 2.43 - Daily chart of Nifty Futures - Bearish Engulfing (the small red setup candle along with the gap down engulfs the entire previous green candle) forms at the upper boundary of a significant gap resistance zone.

Fig 2.44 - Daily chart of Nifty Futures - Multiple instances of Bearish Engulfing in a wide range. Setups that occur at or near the top boundary have the highest conviction
Bearish Setup 2 - Hammer at Resistance
This setup is a single candlestick reversal pattern that forms after a noticeable rise. It has a small body near the low of the candlestick with a long upper shadow, resembling a hammer in reverse.

To be considered tradable within our strategy, the setup must meet specific criteria:
Key Elements for Trade Selection : A good trade should preferably meet most of the elements, based on the overall context of the charting landscape - if you are not sure, do not chase the trade.
-
The upper wick of the candle should be at least twice the size of the real body of the hammer. The longer the upper wick, the stronger the setup.
-
Setup forming at prior resistance level adds to conviction. A confluence of resistances is ideal. For example, a setup at the intersection of strong horizontal and gap resistance has higher odds of success than one at a simple double top (2T). Avoid trades if the setup forms without overhead resistance or at weak resistance.
-
A Reverse Hammer forming within a narrow range or narrow consolidation without any preceding rise does not qualify as a setup. Avoid.
CHART EXAMPLES
Intraday

Fig 2.45 - 1H chart of Nifty Index - Reverse Hammer on C5 forming a double top at gap resistance.

Fig 2.46 - 1H chart of Nifty Index - Reverse Hammer on C5 close to upper boundary of a wide range

Fig 2.47 - 1H chart of Nifty Index - Reverse Hammer on C5 after a breakout from a double bottom pattern aka buy failure

Fig 2.48 - 1H chart of Nifty index - Two instances of Reverse Hammer just 2 days apart. In the first instance, the setup forms on C4 at a confluence of Horizontal R and overhead gap R. In the second instance, setup forms on C3 within a massive gap R.
Positional

Fig 2.49 - Daily chart of Nifty Futures - Small Reverse Hammer that forms after a breakout above Horizontal R into overhead gap R. A strong sell signal aka buy failure that causes a steep and rapid decline.

Fig 2.50 - Daily Chart of Nifty Futures - Reverse Hammer that forms in the middle of a range, however, the high tests a big gap from 5 days back before falling back. Such setups are valid as they confirm weakness.

Fig 2.51 - Daily chart of Index Futures - Reverse Hammer that closes within a narrow congestion zone. Avoid.
Bearish Setup 3 - Range / Pattern breakdown
This setup is characterized by a single candlestick with a relatively large red body that breaches strong underlying support and breaks down from a range or pattern. The breakdown indicates strong bearish momentum and the potential for further price expansion.

To be considered tradable within our strategy, the setup must meet specific criteria:
Key Elements for Trade Selection : A good trade should preferably meet most of the elements, based on the overall context of the charting landscape - if you are not sure, do not chase the trade.
1) The close should preferably be below the nearby support. However, it is acceptable if the close is just above the lowest low of the nearby candles but below the real bodies, provided the breakdown candle is strong (relatively taller than average) and closes near its low. If you are not sure, avoid.
2) When the price gaps up, a close below the opening gap up, such that the gap gets closed, is a valid signal to go short as the strong support offered by the gap is overcome.
3) Avoid trades if the big red candle is the first breakdown close below a prominent range or pattern formed over several days like a big H&S or a prominent range. Such a conspicuous breakdown attracts the attention of the crowd who jump in at the first opportunity. Subsequently, price often retraces, trapping sellers. It's safer to wait for a retracement to resistance (or above) and enter on a second breakout.
Proceed with the trade if the breakdown is not very prominent.
4) Avoid if the breakdown candle closes at or above support as the underlying support may prevent further expansion. For a close within a wide range, go ahead with the trade if there is sufficient room to expand. .
CHART EXAMPLES
Intraday

Fig 2.52 - 1H chart of Nifty Index - Range breakdown on C5 from a small range

Fig 2.53 - 1H chart of Nifty Index - Narrow range breakdown on C5 in the first instance. Second breakdown from a multi day Double Top pattern on C3 in the second instance.

Fig 2.54 - 1H chart of Nifty Index - Narrow range breakdown on C3 preceded by a range breakout failure earlier in the day. A false breakout in the other direction increases reliability of the short trade.

Fig 2.55 - 1H chart of Nifty Index - 1-2-3 Top second breakdown on C4 with a first breakdown failure earlier in the day.
Positional

Fig 2.56 - Daily chart of Nifty Index - Multiple instances of range breakdown

Fig 2.57 - Daily chart of Nifty Futures - Two instances of imminent 1-2-3 Top breakdown. Both are valid setups.

Fig 2.58 - Daily chart of Nifty Futures - Big H&S breakdown that fails on the first attempt to breakdown but succeeds spectacularly on the second. Avoid trading the first breakdown on a prominent pattern. The second is more reliable.
Bearish Setup 4 - Bearish Harami
This signal is a combination of two candlesticks, of which the first is a big green candle and the second is a narrow range (NR) red candle, a.k.a Harami candle, that closes within the real body of the prior big green candle, closing lower. While the first candle signifies strong bullish momentum, the second candle fails to follow through, suggesting a possible exhaustion of bullish momentum and hence, a reversal.

To be considered tradable within our strategy, the setup must meet specific criteria:
Key Elements for Trade Selection : A good trade should preferably meet most of the elements, based on the overall context of the charting landscape - if you are not sure, do not chase the trade.
-
The green candle’s real body should be longer than average and close should be near its high, signifying strong bullish momentum.
-
The signal candle should have a narrow range and should preferably close near its low, within the upper half of the real body of the prior long green candle.
-
The signal candle’s high should not breach the high of the prior green candle, preferably, or the breach should be small. If the former travels significantly higher before pulling back, it is no longer a Bearish Harami but probably a Reverse Hammer. It is important to distinguish between the two as both have different payoffs.
-
The big green and the harami candle should either form at prior resistance or after a breakout by the prior big green candle from a range or pattern. The latter is a particularly stronger setup because of the potential "trap effect". Avoid signals that form in a range or vacuum without any nearby resistance.
CHART EXAMPLES
Intraday

Fig 2.59 - 1H chart of Nifty Futures - Bearish Harami on C4 just below horizontal resistance after a breakout from a Reverse H&S earlier in the day.

Fig 2.60 - 1H chart of Nifty Futures - Bearish Harami on 2 successive days following a big green breakout.

Fig 2.61 - 1H chart of Nifty Futures - Bearish Harami on C4 after break out from a narrow range.
Positional

Fig 2.62 - Daily chart of Nifty Futures - Multiple instances of Bearish Harami on daily chart at horizontal / gap resistance. The first fails. The second coincides with a buy failure after a prominent breakout, leading to a fast and furious decline.

Fig 2.63 - Daily chart of Nifty Futures - Another example of a Bearish Harami appearing immediately after a breakout from a Reverse H&S. A powerful buy failure that leads to a significant fall.

Fig 2.64 - Daily chart of Nifty Futures - Two instances of a Bearish Harami setup after a range breakout. The first appears at overhead horizontal resistance and the second at overhead gap resistance.
Bearish Setup 5 - Dark Cloud Cover
Dark Cloud Cover is comprised of a single candlestick, that often appears after a significant bullish trend. It opens above the previous candle’s high but closes within the real body of the previous candle, preferably below its midpoint. However, for the purpose of this setup, a candle opening with a large gap up but reversing to close weak even within the gap is considered as a valid setup. The setup often signals a strong reversal of the ongoing bullish trend to bearish.
The setup is valid only for positional trading as a gap up rarely occurs in the course of intraday trading.

To be considered tradable within our strategy, the setup must meet specific criteria:
Key Elements for Trade Selection : A good trade should preferably meet most of the elements, based on the overall context of the charting landscape - if you are not sure, do not chase the trade.
-
The present trend should be preferably up or sideways. Typically, the signal often marks a false breakout from a range or a pattern on the upside followed by a trap reversal.
-
A strong Dark Cloud Cover setup can form in either of the two ways described below, with the latter being stronger, as it is a sell failure
I. Open with a significant gap up (avoid small gap ups), with the high testing prior resistance without breaching it. Strong reversal thereafter to fill the opening gap and close near its low, in the real body of the previous green candle.
II. Open with a significant gap up above resistance and subsequent reversal to close below resistance. This adds conviction to the setup as it traps the bulls, strongly implying a move in the opposite direction.
Sometimes, when the opening gap is abnormally large and above strong resistance (usually because of a favorable development overnight), the setup candle may not be able to fill the gap completely, but still close weak inside the gap, near its low. This is also an acceptable bull trap signal that has strong implications of an aggressive downward move.
-
There is enough room to expand to meet the price target. Avoid when the close is in the middle of strong congestion or significant underlying support.
CHART EXAMPLES
Positional

Fig 2.65 - Daily chart of Nifty Futures - Dark Cloud Cover forms with a massive gap up above resistance and sharp reversal that fails to fill the gap completely. Valid setup.

Fig 2.66 - Daily Chart of Nifty Futures - Price gaps up to test the prior pivot resistance and reverses to almost fill the gap, forming a Double Top. The next candle is a big red candle.

Fig 2.67 - Daily chart of Nifty Futures - Setup candle gaps up above the upper boundary of a wide range but reverses sharply to close within the real body of the prior green candle. A buy failure with price declining very sharply.
Bearish Setup 6 - Big Red on C1 or C2
This setup is a single strong red candle that forms on either C1 or C2, which is a continuation of an existing bearish trend or a bearish breakdown from a range or pattern. Most of the signals appear on C1, however, the setup appearing on C2 is valid if if C1 does not offer clarity.
Unlike the previous setups, it is traded only intraday in the morning, mainly to ride any big trend that sets up in the morning rather that wait till the afternoon by which time the major part of the move would be over.

To be considered tradable within our strategy, the setup must meet specific criteria:
Key Elements for Trade Selection : A good trade should preferably meet most of the elements, based on the overall context of the charting landscape - if you are not sure, do not chase the trade.
-
The big red candle on either of C1 or C2 must form under one of two scenarios.
I. Bearish Continuation: The trend on the daily timeframe should be already bearish, and C1 (or C2) reaffirms the continuation of this trend.
II. Bearish Breakout: There should be a clear range or a bearish pattern forming on the hourly chart (from previous day/s), and C1 (or C2) represents a clear breakdown. The trend on the daily timeframe should be preferably bearish but can also be bullish before forming the sideways range or pattern.
-
Avoid the trade if the big red candle closes just above underlying support or within a narrow congestion zone which offers no room to expand.
-
In the case of a breakdown, avoid the trade if the signal breakdown candle opens with a massive gap such that the technical target is already met. In such instances, price is likely to go sideways or even retrace.
-
The close of the signal candle should be near its low. In case of a long lower wick, avoid the trade.
CHART EXAMPLES
Intraday

Fig 2.68 - 1h chart of Nifty index - Big Red at C1 - Gap breakdown from a narrow congestion zone that formed the previous day at the confluence of horizontal and gap resistance after a failed attempt to break out. A buy failure.

Fig 2.69 - 1H chart of Nifty Index - Big Red at C1 that is an example of both a continuation of a bearish trend prevailing over the past several days and a breakdown from a descending triangle.

Fig 2.70 - 1H chart of Nifty Index - Multiple instances of Big Red at C1/C2, both breakdown and bearish continuation.