
All Time Highs on Nasdaq and S&P, sell signal on DJIA - What lies ahead?
While Nasdaq and S&P have made new ATHs on Friday, DJIA has given a classic sell signal the same day. After forming a big bullish engulfing candle on Thursday, DJIA has formed a Bearish Harami pattern on Friday after breaching the range briefly on the upside - a subtle but proven sell signal that combines well with the prior strongly bullish candle.
While Nasdaq has rallied strongly on Fridaay, S&P has formed a Reverse Hammer after a strong breakout the prior day, a strong sell signal.
Daily charts of DJIA, Nasdaq and S&P Futures below:

DJIA Daily Chart showing a Bearish Harami sell signal last Friday
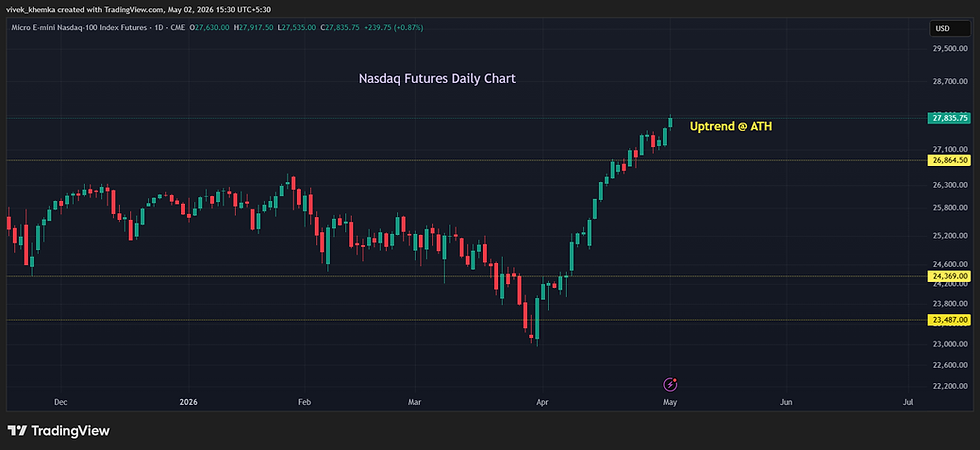
Nasdaq Daily Chart showing a breakout above consolidation at a new ATH

S&P Daily Chart showing a Reverse Hammer after a strong Bullish Engulfing breakout, a buy failure
Will the sell signal on DJIA and S&P work to start a new bear trend? Let time tell.
Please scroll below to subscribe to our website for regular updates on the global financial and commodity markets.


Comments