
US markets gain for the sixth straight week - Financial Analysis for the week ended 18 Oct, 2024
- Oct 19, 2024
- 2 min read
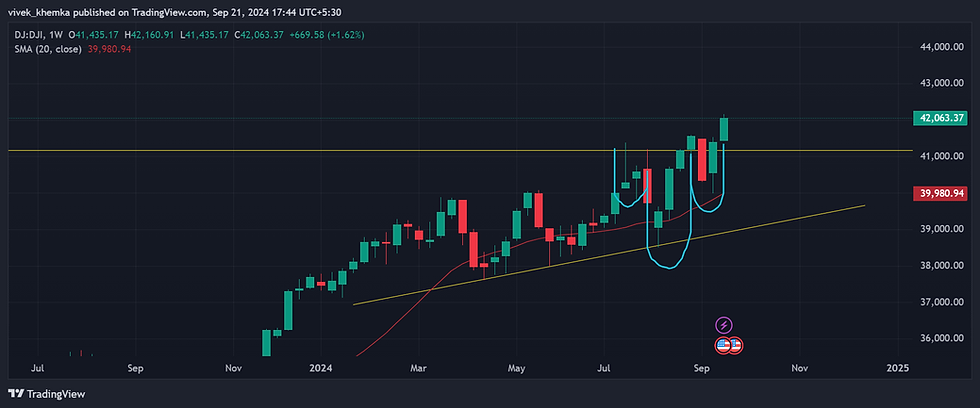
The analysis for the last week ended 11h October mentioned breakouts from bullish patterns for the US indices on the weekly charts that would provide the impetus for the price to move northwards. The market has done just that. While the DJIA and S&P have continued their march northwards to make new highs in the week that marks the sixth straight week of advance, Nasdaq has moved tentatively to get closer to the previous high made in July 2024. The DJIA chart is given below.
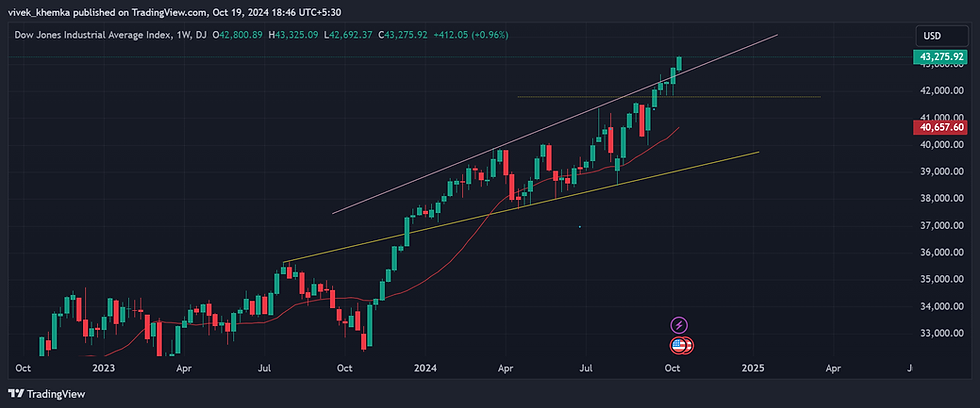
Fig 1 - Weekly Chart of DJIA showing a new high post the breakout from a broadening pattern
With the presidential elections just round the corner, and given the unrelenting rise for 6 weeks, the market may consolidate at these levels for the next couple of weeks. The course of the markets post the elections would most likely be dependent on the outcome of the elections.
The European markets look good on the charts for a bullish move with the DAX already leading the pack with a new lifetime high and close during the week. The FTSE100 Index weekly chart is given below that shows a rounding bottom pattern which looks like on the verge on breaking out, with the latest weekly candle closing above resistance.
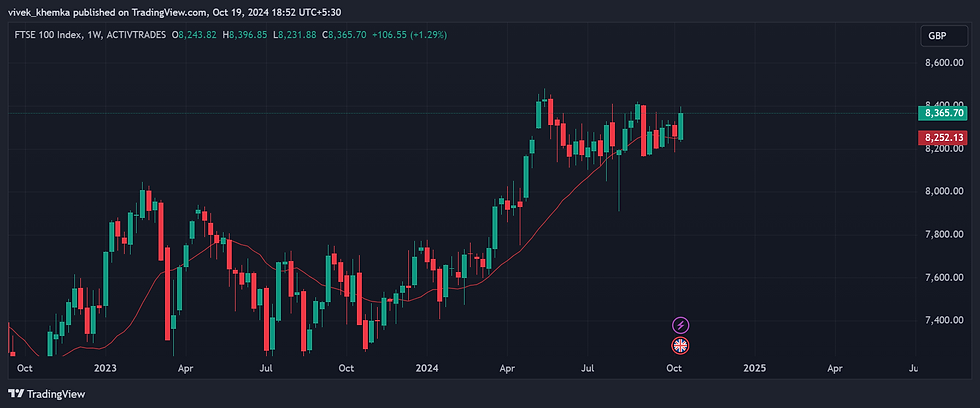
Fig 2 - Weekly Chart of FTSE100 showing rounding pattern that looks ripe for a breakout
The Indian markets are poised interestingly for the week. Nifty opened gap down marking a break below a H&S pattern in the morning on Friday, only to bounce back sharply in the morning itself and trending upwards through the day. With this, the daily candle for Friday has formed a Piercing Pattern, a bullish event. This move is a "sell failure" of a major bearish pattern that sets up like a trap for the bears, resulting in a move in the northward direction that quickly travels a large distance in a short time. Chart below.
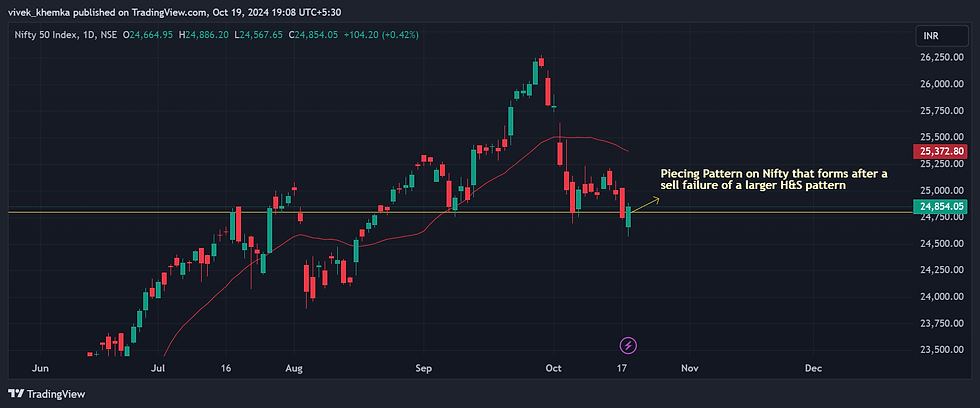
Fig 3 - Daily Chart of Nifty showing a Piercing Pattern after a sell failure of a large H&S pattern
Banknifty has formed a large Bullish Engulfing pattern on Friday that has also broken out of a 1-2-3 bottom pattern, with strong bullish implications. Chart below.
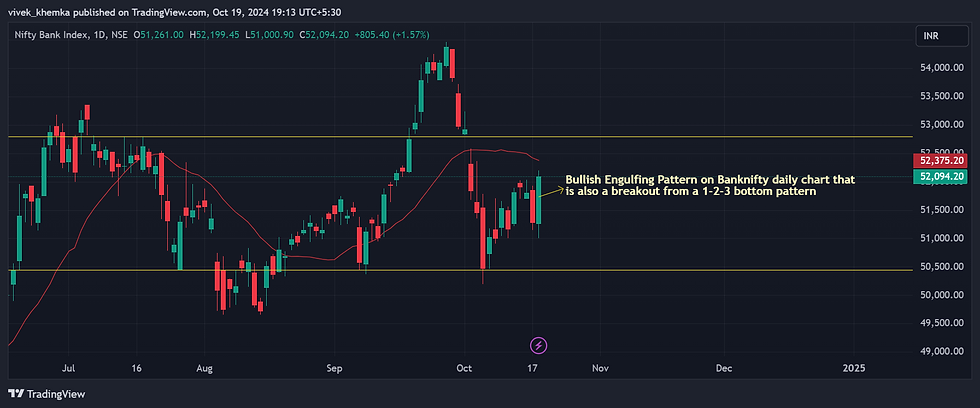
Fig 4 - Daily Chart of Banknifty showing a Piercing Pattern after a sell failure of a large H&S pattern
The Indian markets look good for a bullish move in the coming week given the surprise big reversal on Friday, at least in the early part of the week. As mentioned above, the sharp reversal after a breakdown is likely to to provide the fuel for the move.
Please scroll down to the bottom of this post to subscribe to the mailing list for regular market and trade updates.


Comments