
All Time High on Dow - Financial Analysis for the week ended 11 Oct, 2024
- Oct 13, 2024
- 2 min read
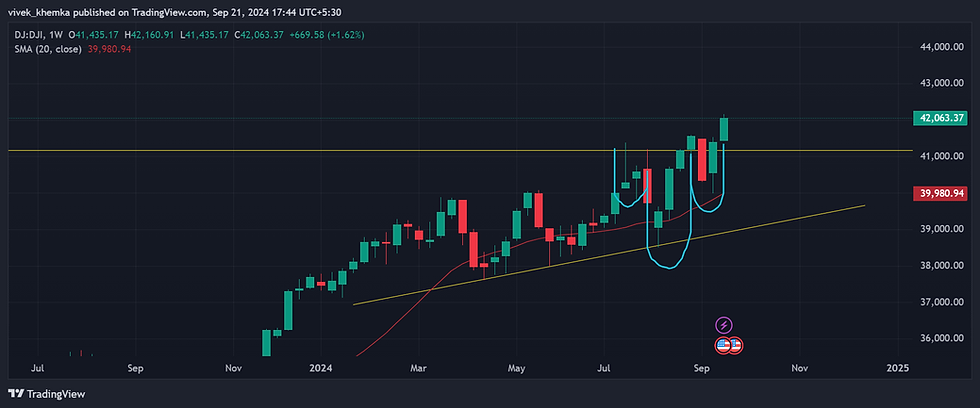
The DJIA broke out of a broadening pattern at the top on the weekly chart and closed almost at the All Time High of 42900 on Friday, the 11th of October, 2024. Nasdaq has been sideways for the last couple of weeks after a breakout above a bullish 1-2-3 bottom, but the candle for the last week shows it breaking out of a narrow 3 week range, a bullish event. S&P has a similar chart except for the fact that it has already closed at an all time high last Friday.
The latest chart formations and breakouts looks good for another move northwards, no matter what the state of the economy is or what the latest inflation reading is. Even the widening trade wars between China and the ROW do not matter. The market has spoken. Can this be a false breakout? Well, I do not know but there is no reason to believe so at this point. Charts below.

Fig 1 - Weekly Chart of DJIA showing a breakout from a broadening pattern
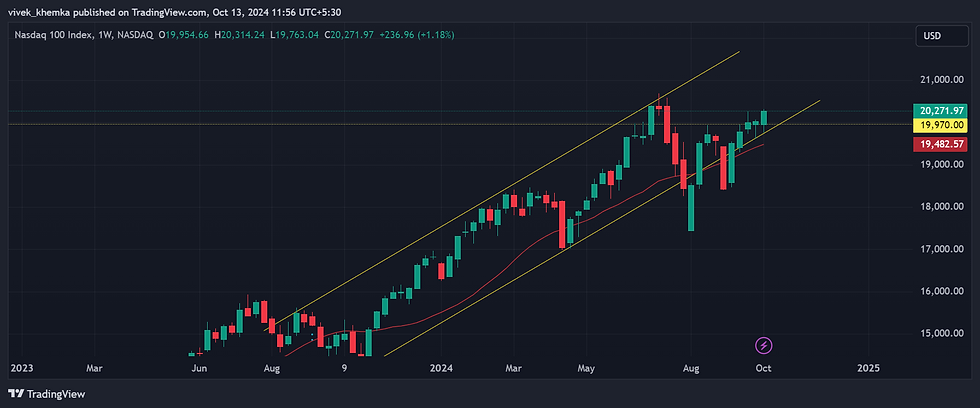
Fig 2 - Weekly Chart of Nasdaq showing a breakout from a brief consolidation after a breakout from a 1-2-3 bottom formation

Fig 3 - Weekly Chart of S&P showing a breakout to a new All Time High after a brief consolidation
While the US market has spoken, the European markets of FTSE, CAC and DAX are in a consolidation phase. However, the weekly charts do not indicate bearishness. The Euro STOXX 50 Index even looks like on the verge of breaking out to an All Time High. The Asian markets are a mixed bag. Most are consolidating sideways after making a significant bottom or are taking a pause after making a new intermediate high.
The Indian markets too have taken a breather over the last couple of weeks. After making a big bearish engulfing pattern on the weekly chart the week before, last week saw a moderation in the selling momentum, with the Nifty forming a narrow range Bullish Harami candle. The technical implication of such a candle forming just after a strong red candle is bullish.
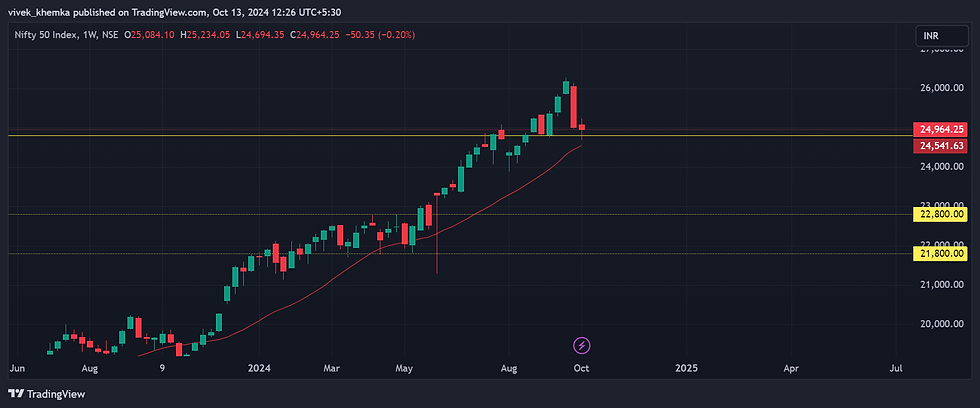
Fig 4 - Weekly Chart of Nifty showing a narrow Bullish Harami candle after a big red candle in the prior week, a bullish formation
Banknifty has formed a small bullish hammer on the weekly chart at support. The MidCap and SmallCap indices have formed strong hammers on their charts that have closed deep inside the big red candle of the prior week, a very bullish formation. Let us see if this translates into a bullish move, at least in the early part of next week.
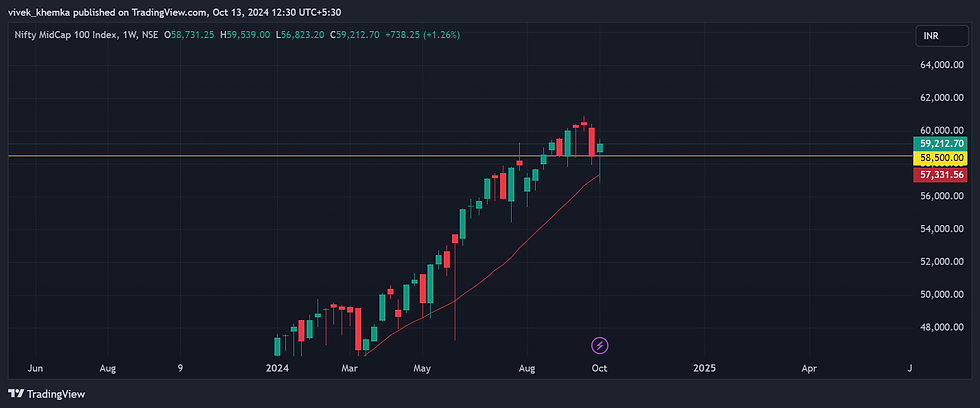
Fig 5 - Weekly Chart of Midcap100 Index showing a strong hammer closing deep inside of a big red candle in the prior week, a bullish formation
Overall, the US markets with fresh breakout signals on the weekly charts, are likely to lead the way for the global markets to rise northwards. The Indian markets also seem to have recovered from the big blow in the prior week and should attempt a decent recovery in the coming week.
Please scroll down to the bottom of this post to subscribe to the mailing list for regular market and trade updates.


Comments