
US markets at all time highs - What's next? - Financial Market analysis for the week ended August 15, 2025
- Aug 17, 2025
- 2 min read
Dow and S&P made an ATH last Friday but could not sustain and came down by the end of the session to form bearish candles.
While Dow opened with a big gap up ~250 points, it could not sustain the high and filled the entire gap by end of day, forming a big red candle while closing near the low. S&P also opened with a mild gap up to form a new all time high but formed a small bearish engulfing candle by the end of the day, engulfing 2 narrow range candles of Wednesday and Thursday. See the daily charts below.

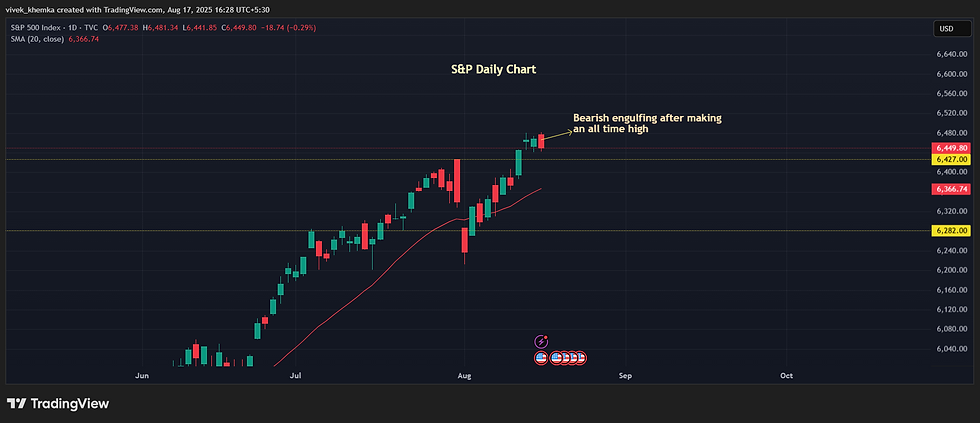
The bearish price action on the US indices on Friday invites suspicion over the ATH reached earlier in the day. Is is a trap for the bulls or only a case of mild fatigue after a small uptrend? Only time can tell. After all, it would take only one strong green candle for the markets to signal the breakout to be genuine. However, at this point of time, bearish action right after reaching ATH does not seem to augur well for the bulls. Looks like a bull trap.
To talk about the Indian markets, Nifty has been a picture of confusion over the last 7 trading days. Daily chart below.

Consider this -
✅ 7th August - Nifty gives a very strong buy signal on the charts, forming a strongly bullish piercing pattern after a comprehensive breakdown of support @ 24500, a trap for the bears (also called a sell failure).
✅ 8th August - Nifty does exactly the opposite of expected, forming a strong bearish engulfing pattern and a fresh sell signal.
✅ 11th August - Nifty again reverses, this time forming a strong Bullish Engulfing pattern, closing back into the range. Forms a double bottom pattern that awaits a breakout for a strong buy signal that again reinforces a sell failure.
✅ 12th August - The breakout happens on schedule but reverses course during the day, forming a reverse hammer, thus trapping bulls.
✅ 13th and 14th August - Inside narrow range candles with no direction.
👆 Incredible whipsaws that would draw blood from most of the traders, I would imagine. The message from the market seems to be - "Stay away for now!"
Overall, it is hard to imagine what lies ahead for the global as well as Indian markets, given the price action. The macro environment has also been blurry with conflicting signals. The US economy remains on a strong footing with a "hotter than expected" PPI reading of July amidst rising wholesale inflation and moderating CPI. The market participants have significantly tempered their rate cut expectations in September, not a positive for the markets. Let time tell.
Please scroll down to the bottom of this post to subscribe to the mailing list for regular market and trade updates.


Comments