
Nifty buy and DJIA sell signal? Technical Analysis of Indian and Global Markets for the week ended 12th December, 2025
- Dec 14, 2025
- 2 min read
On Friday, the charts of Nifty and global markets moved in opposite directions, making it difficult to form a clear view for the coming week. Let’s break it down.
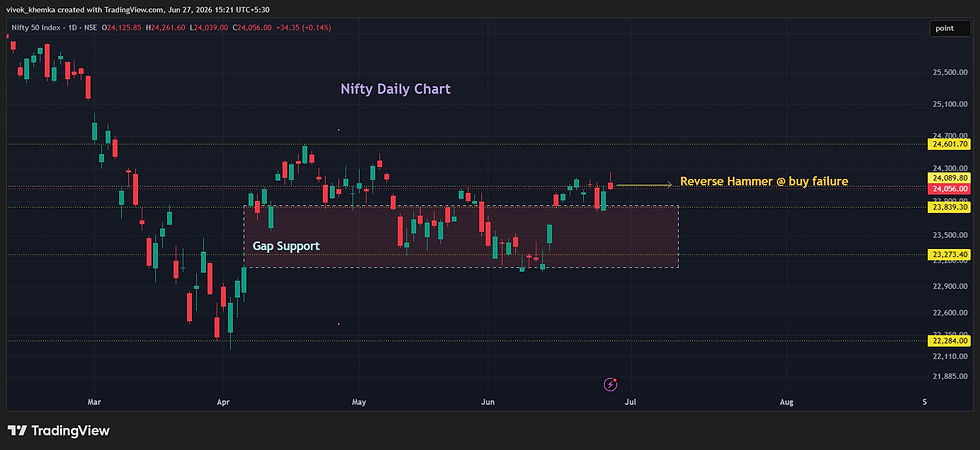
On the Nifty daily chart, the index broke below a trading range earlier in the week but quickly reversed on Thursday and finally closed back inside the range on Friday after a gap up open. This is a classic false breakdown, where the price action pushes decisively northwards.

The broader market supports this view. Both Nifty Midcap and Smallcap indices also reversed after false breakdowns, indicating strong buying interest across the market.

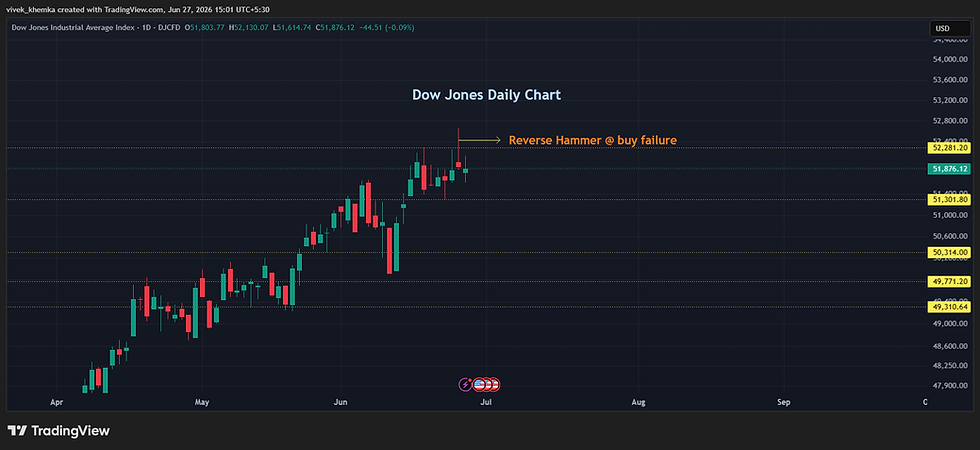
While the Indian market picture is clearly bullish, the confusion comes from global markets, especially the US. On Friday, US markets sold off sharply after 2 days of bullish action following the Fed rate cut, including an ATH on DJIA on Thursday.
Here’s what the US charts show:
1️⃣ Dow Jones formed a Bearish Harami pattern after breaking to a new high, which is a sell signal.
2️⃣ Nasdaq broke decisively below its trading range with a strong red candle.
3️⃣ S&P 500 formed a large Bearish Engulfing candle, breaking below a range but managing to close back inside it.


European markets followed the US lead, falling sharply from intraday highs and closing weak, which is also a bearish signal. Asian markets, however, are showing mixed signals.
Despite the above, it remains to be seen whether the bearish action on Friday is just a short-term shakeout or the start of a deeper correction.
In summary, Indian markets look strong and in a clear buy zone, while US and European markets are uncertain. Only time can tell what happens next.
Please scroll down below to subscribe for regular updates on the global financial markets.

Comments