
Candlestick Pattern - Narrow Range including Bullish or Bearish Harami
- May 10, 2024
- 2 min read
Updated: Jun 23, 2024
Narrow Range (NR) is a candlestick pattern characterized by a relatively small price range between the high and low prices compared to previous candlesticks. It suggests a contraction in price volatility and indecision in the market. It indicates that neither buyers nor sellers have gained significant control over the price direction during the trading period.

(Fig 1.6 - Narrow Range, Inside Bar and Harami)
It becomes an Inside Bar if it is completely engulfed by the trading range of the previous candlestick. It can form anywhere within a series of candles, whether there is a trend or the price action is sideways. If it forms within a sideways market, it does not have much meaning. However, if it forms within a trend preceded by a large candlestick in the opposite colour, it is known as a Harami and suggests a potential reversal.
For example, a Bullish Harami occurs when the candlestick is a NR green candlestick and is contained within the lower half of the previous long red candlestick in a downtrend. It suggests a slight shift in momentum on the downside leading to a potential reversal from a downtrend to an uptrend. Vice versa for Bearish Harami.
Though a Narrow Range candle in itself does not have much meaning, but a series of such bars signifies reducing volatility and the market reaching a stage of equilibrium. Normally, the market does not stay in equilibrium for long and makes a big move once the equilibrium phase is over. So you should expect a big move after a series of Narrow Range candles, particularly if they occur near a breakout or breakdown level.
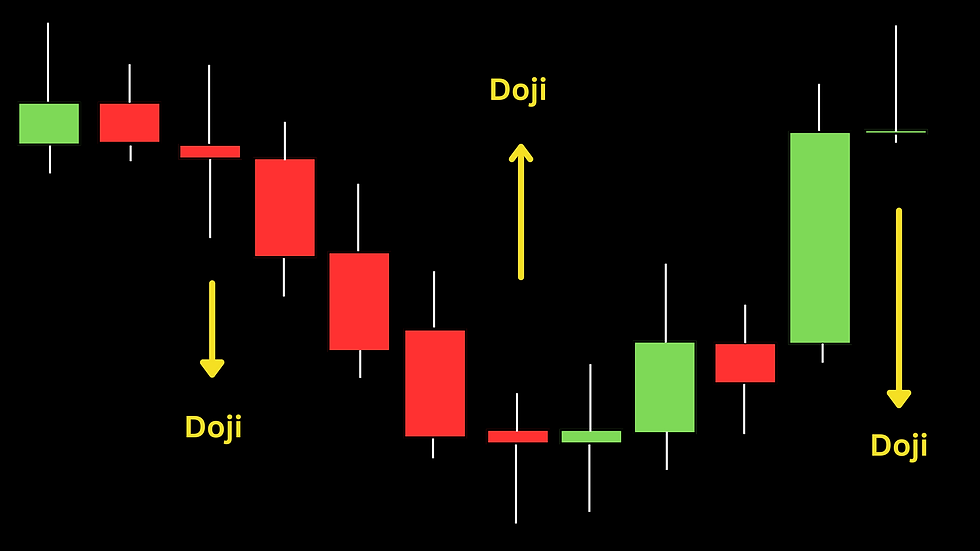
For example, if you find NR candles very close to the neckline of a large H&S pattern a breakout may be imminent. Another example is when a series of NR candles form in combination with Dojis after a good trending move, you should expect a meaningful reversal.
With this, we have covered the candlestick patterns that are relevant to our Trading System. As we mentioned before, there are umpteen other patterns which are either a combination of the above patterns or are not relevant to our Trading System.
Please click on "Next Post" to move to the next technical tool that we need to know - Chart Patterns.


Comments