
Big Red Candle last Friday on DJIA - what lies ahead?
- Jun 7
- 1 min read
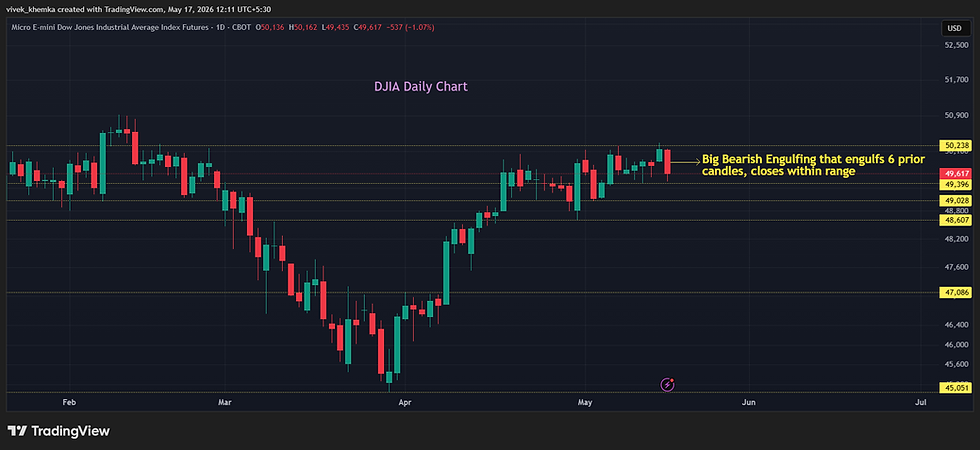
DJIA formed a big red Bearish Engulfing candle last Friday following a strong green candle the day before. The candle made a new ATH earlier in the day, before crashing by a relatively modest ~ 1.35% for the day. However, the pattern that it formed was a buy failure as the previous day's candle was a buy signal that failed. This is a very potent sell signal as it catches die hard bulls on the wrong foot, even more lethal when it happens at an ATH.

If what looks likely materializes and the market corrects fast and violently next week, it may cause panic selling that might feed on itself, given the historic levels of concentration in the top 12 technology and communication stocks (>50% of the entire market cap of S&500, much higher than the dot com era).
There are already signs of a crack visible in the tech heavy Nasdaq with a big Bearish Engulfing pattern forming on the weekly chart after a relentless rise saw it making a new ATH in 28 out of 35 day sessions ever since it made a new ATH on 15th April of this year. The story is more or less similar for S&P500 that is highly correlated with Nasdaq.

European and Asian indices are yet to follow through with a convincing signal as of last week, but that might change early next week if the US indices slide.
Let the markets decide where they want to head next.
Please scroll below to subscribe to our website for regular updates on global financial and commodity markets.


Comments