
Bear trend on Nifty - A timeline of the traps laid to slaughter the bulls
- Feb 24, 2025
- 2 min read
The last all time high on Nifty was made on 27th of September, 2024 at 25277. It has been 5 months of a cold and harsh winter ever since. What began as a regular pullback seems to be deepening into a full blown bear trend.
Given below is the extent of the pullback across indices over the last 5 months and their comparison with the fall in 2020 over just 2 months for a proper perspective.
Nifty - 13.5% (39.6%)
Banknifty - 10.3% (50.6%)
CNXIT - 12.3% (34.9%)
CNX Midcap - 20.4% (41.9%)
CNX Midcap - 23.3% (50.0%)
As you would see, the fall in frontline indices in the current period has only been 33% in the case of Nifty and IT, 20% in the case of Banknifty and about 50% in the case of Midcap and Smallcap, over a period of 5 months compared to 2 months in 2020. The decline has happened mainly in grinding fashion, with intermediate bouts of sideways action followed by a bullish pattern or a bullish breakout.
Typical of a bear market, the bullish patterns and breakouts, never saw any follow through. Even though the fall itself has not been ferocious, but the repeated failure of bullish signals leads one to believe that this could just be the start of a bear trend that would unravel in a painfully slow manner. The trend may even gather speed in the times to come but that is difficult to predict, given the uncertain times we are in the post Trump era.
Given below is a timeline of such failed bullish patterns and breakouts on Nifty.
27th Sep, 2024 - A new hall time high on Nifty
8th Oct, 2024 - Bullish Harami at support. No follow through bullish action.
18th Oct, 2024 - Piercing pattern, a strong bullish pattern. Fails immediately on the next candle with price descending to new lows.
5th Nov, 2024 - Piercing pattern again. Works for 1 day leading to a breakout above congestion that fails the next day.
5th Dec, 2024 - Reverse H&S breakout after a long sideways consolidation. No follow through. The price action goes sideways for about 7 days before breaking down.
2nd Jan, 2025 - Breakout above congestion. False breakout as the price immediately breaks lower.
31st Jan 2025 - Breakout above congestion. The price action follows through for a couple of days but descends sharply thereafter, falling for 8 days in a row.
17th Feb, 2025 - Piercing pattern after a sell failure , a very strong bullish pattern. The price action goes sideways for the next few days before descending to a fresh low.
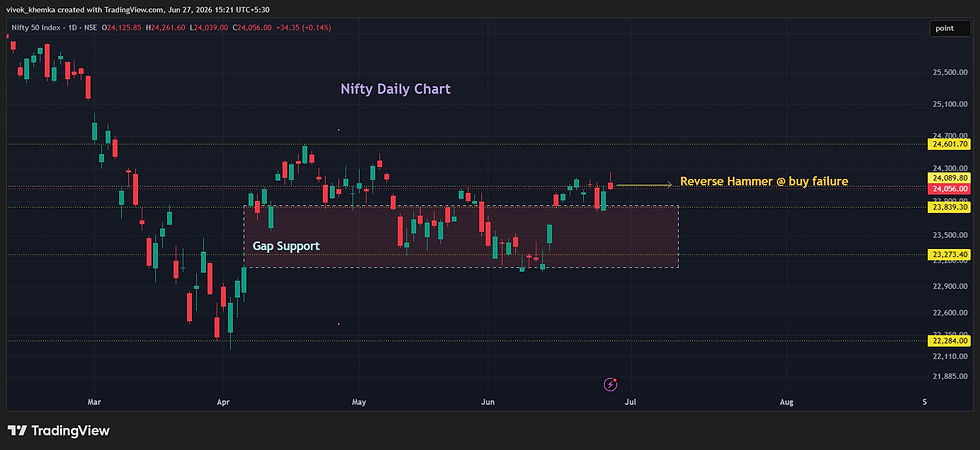
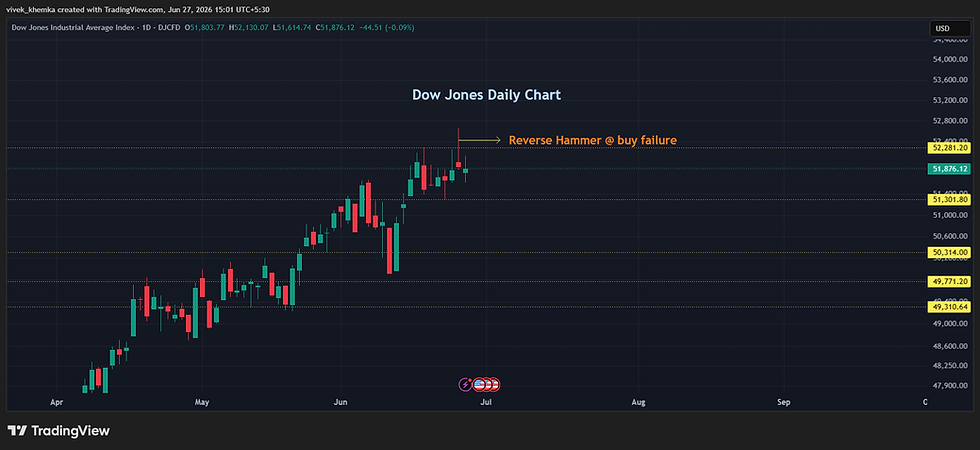
Look at the 2 daily charts below with annotations that illustrate the above timeline.

Fig 1.1 - Daily chart of Nifty illustrating the timeline of failed bullish patterns and breakouts

Fig 1.2 - Daily chart of Nifty illustrating the timeline of failed bullish patterns and breakouts
Please scroll down to the bottom of this post to subscribe to the mailing list for regular market and trade updates.

Comments